Performance Chart
.
.
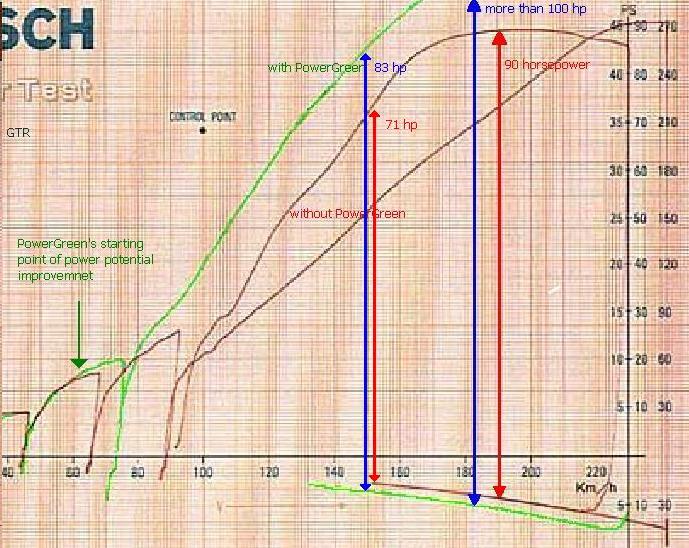
Following is a performance chart executed with BOSCH analysis equipment for a test on a Nissan Skyliner GTR. The diagram shows the differences without PowerGreen (red line) and with PowerGreen (green line). The second red line is the computer control line (second red line).
As you can see, speeding up to 60 km/hr doesn’t show significant differences in the performance. There are slight changes in the higher speeds while the improvement begins (green arrow) to show in additional horsepower.
--------------------------------------------------------------------------------------------------------------------------
At speed of app. 150 km/hr or app. 180 km/hr the red arrows show app. 71 horsepower or 90 horsepower driving without PowerGreen but at the same speed, the blue arrows show app. 83 horsepower or more than app. 100 horsepower this time with the PowerGreen devise.
As you know, speed of the vehicle is subject to the load or weight of the vehicle multiplied by the energy used. This means that the engine has to work harder to pull a heavy load. In the case of a heavy truck, it may take the same energy or fuel consumption for the truck to travel at 80 km/hr as it would for a lighter weight car to travel at 180 km/hr.
With the addition of the PowerGreen unit, your vehicle will have a cleaner burning fuel which equals more horsepower which equals more miles traveled on less energy which ultimately equals less fuel used.
Another benefit is that cleaner burning fuel releases less toxins and particle matter in the vehicle’s exhaust.
Click here and read what our satisfied customers have to say!
![]()

Copyright 1997-2002 m.i.m. Modern International Media Publishing Company